Your Analytics in Willow give you a clear overview of your channels' performance and a breakdown by channel. Additionally you can have a clear view of which posts worked well on your channels. This article covers each part of the Analytics figures that you can find in Willow. Additionally you can have a clear view of which posts worked well on your channels. This article covers each part of the Analytics figures that you can find in Willow.
Jump to:
Overview
The overview tab in your Willow account allows you to discover all the data and metrics from your social media posts. You'll be able to see how many impressions and engagement you had as well as how many new followers you gained.
The post tab allows you to see which posts worked the best. This is valuable information as you can implement these kinds of posts more frequently in your social media strategy.
Analytics summary
The analytics summary gives you a clear overview of the 4 most important metrics: impressions, engagement, total audience and new followers.
Additionally, it gives you an indication of how much of an increase or decrease you had in comparison to a previous period of time.
The 4 graphs put the data more into perspective and allow you to see the growth over a certain period of time.

Change the reporting period
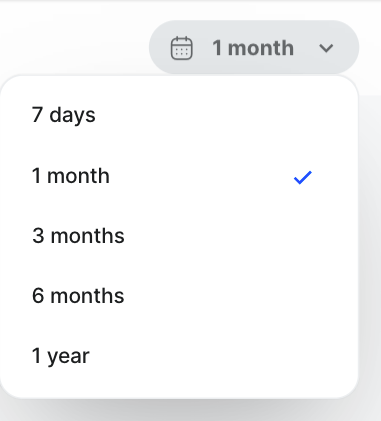
You can choose the period of time for the reports by clicking on the calendar button on the right top side. You now have the choice between 7, 30, 90 and 180 days. The latter is particularly interesting because it grants you the opportunity to see your growth on social media for a longer period of time.
The standard setting is 30 days.
Choose your channels
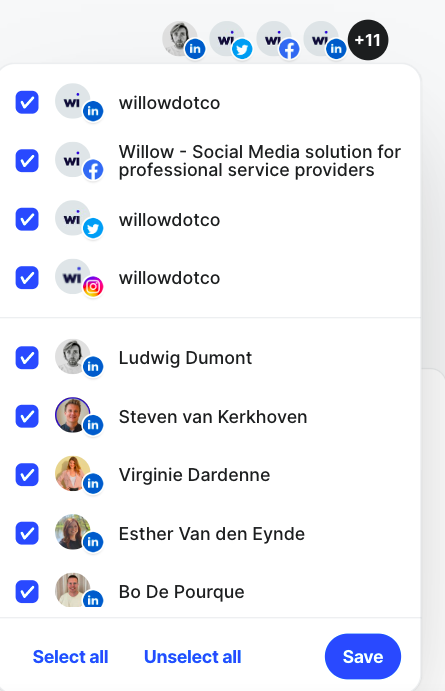
You can also click on a social media icons at the top right side, just under the calendar to select or deselect several channels. This gives you the opportunity to see the social media metrics for a particular business page or LinkedIn profile.
Channel breakdown
The Channel breakdown lists all business accounts (not including personal pages) and gives you a short and clear overview of the audience, impressions, engagement and amount of published posts for this profile.

Employee Engagement
The employee engagement leaderboard lists all the connected personal LinkedIn profiles, how many posts they made and the total engagement.

Post overview
The post overview allows you to see which posts, for the selected time frame, worked best for the different channels. Each post is accompanied by the total amount of engagement, impressions, engagement rate and an overall post score.
You can select, or deselect, the different channels to view each channel's posts individually.

You can scroll over your engagement number to have a breakdown of which engagements you specifically had on a certain post.

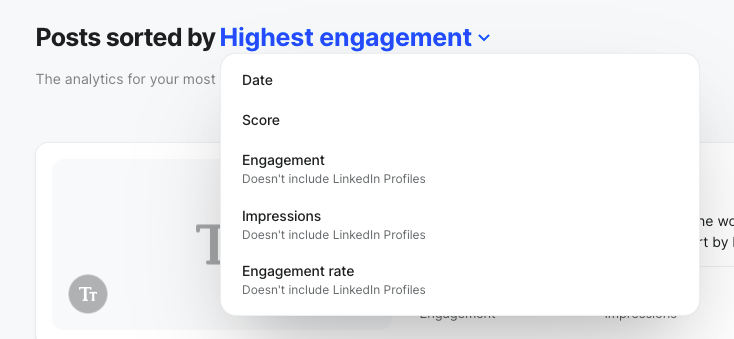
The posts are automatically sorted by highest engagement, because it's the most important metric. You can, however, choose another sorting method by clicking on "Highest engagement".